What Does the Red Mean on Google Maps
July 29, 2025
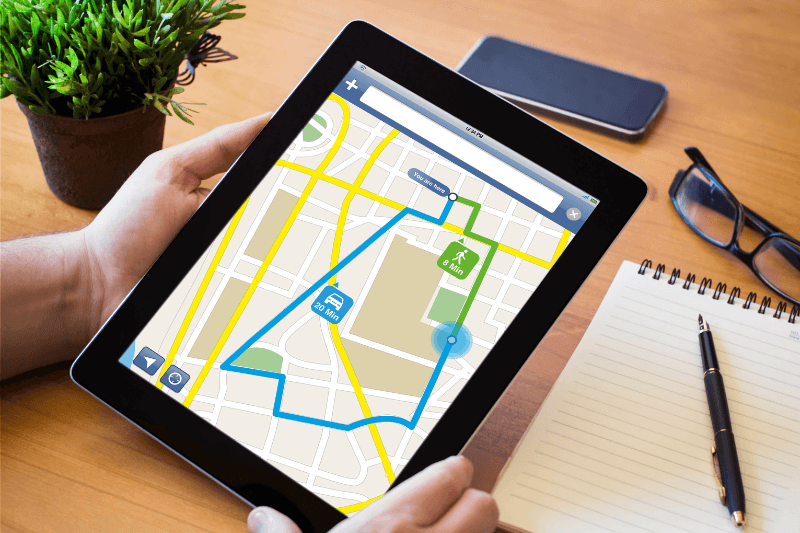
Google Maps has become an indispensable tool for daily navigation, route planning, and simply understanding the world around us. While its core function is to show us where we are and where we’re going, the dynamic colors overlaying the roads offer a wealth of real-time information. Beyond just showing roads and maps directions, these hues are an instant guide to traffic conditions, helping you make informed decisions to optimize your travel time.
Together with maps directions and data, MyRouteOnline Map Calculator is able to provide a more complete route optimization experience.
Google Maps Traffic is Signifies by Green, Yellow, and Red
The most common and crucial colors you’ll encounter on roads in Google Maps directly relate to traffic flow:
- Green Means No Delays – A green line on a road indicates smooth, free-flowing traffic. This is the ideal scenario – you can expect to travel at or near the posted speed limits with minimal to no delays. When you see green, you’re on the fastest path.
- Yellow or Orange Means Moderate Traffic – When a road turns yellow or orange, it’s a sign that traffic is moderate. Vehicles are moving, but you’ll likely experience some slowdowns. This could mean slightly reduced speeds, more frequent braking, or minor delays at intersections. It’s not a full stop, but it’s not entirely clear sailing either.
- Red Means Heavy Congestion – Red is the universal warning for traffic congestion. This is where you’ll encounter significant slowdowns and potential delays. The intensity of the red further refines this warning:
- Standard Red: Indicates heavy traffic where vehicles are moving slowly. You’ll likely experience noticeable delays.
- Dark Red or Maroon: This is the most severe level of congestion, signifying very heavy traffic, often stop-and-go, or even a complete standstill. If you see dark red, be prepared for substantial delays, and consider looking for alternative routes.
How Google Maps Collects its Data
Google Maps’ impressive real-time traffic accuracy is a marvel of data collection and algorithmic processing. It’s not magic; it’s a sophisticated system that gathers information from multiple sources:
- Anonymous GPS Data (Crowdsourcing): A significant portion of Google’s traffic data comes from the millions of smartphones and other devices with Google Maps open and location services enabled. This anonymized data provides real-time speed and movement information of vehicles on roads, forming the backbone of the live traffic updates. If many users are moving slowly on a particular road, that data is aggregated and translated into a yellow or red line.
- Historical Traffic Patterns: Google Maps also utilizes vast amounts of historical traffic data. It knows, for example, that a particular highway might be congested every weekday morning between 7:00 AM and 9:00 AM, even if there aren’t many active users on that road at a specific moment. This allows the system to predict future traffic conditions, especially for typical commute times.
- Traffic Sensors and Cameras: In many major urban areas, government transportation agencies and private companies operate traffic sensors embedded in roads or cameras overlooking key arteries. These sensors provide valuable data on vehicle volume and speed, which Google integrates into its system.
- User-Generated Reports (Waze Integration): With the acquisition of Waze, Google Maps also benefits from community-driven incident reports. Users can manually report accidents, road hazards, speed traps, and other events that impact traffic flow, adding another layer of real-time accuracy.
Other Important Colors on Google Maps
While traffic is a primary use case for the colored lines, Google Maps uses a broader palette to convey different types of information:
- Blue: When you’ve set a destination and Google Maps is providing navigation, the recommended route is typically highlighted in blue. This signifies your active path.
- Gray: Most roads that are not part of your active route or don’t have real-time traffic data displayed will appear in gray. Major highways might be a darker gray, while local streets are lighter.
- Green (for Biking): If you enable the biking layer, green lines will appear on bicycle-friendly roads, dedicated bike lanes, and trails. Different shades or dashed lines can indicate the type of bike route.
- Light Tan / Beige: This color often represents commercial or urban areas, including city centers, business districts, and areas with many shops and buildings.
- Light Gray (for Areas): Often used for residential areas or non-commercial zones.
- Various Shades of Green (for Land): Parks, forests, and other natural green spaces are represented by different shades of green, distinguishing between dense foliage and more open parkland.
- Blue (for Water): Rivers, lakes, oceans, and other bodies of water are consistently depicted in blue.
- Brown/Light Brown (for Land): This can signify diverse natural landscapes, from deserts to national parks or mountain ranges, often labeled to provide more context.
Using Google Maps for Smarter Travel
Understanding these colors empowers you to:
- Avoid Congestion: Actively monitor red zones to choose alternate routes, saving time and fuel.
- Plan Ahead: Use the “Depart at” or “Arrive by” feature to see predicted traffic conditions for future trips, helping you choose the best time to leave.
- Understand Road Conditions: Quickly grasp the traffic situation with a glance, even if you’re not actively navigating.
- Discover Alternative Transportation: If traffic is severe, the colors might prompt you to consider public transport options offered within Google Maps.
In a world where time is a valuable commodity, Google Maps’ colorful insights provide an invaluable service. By learning to read the map’s visual language, you gain the power to make smarter travel decisions and navigate your world with greater efficiency and less stress.